Work
Tas Health Pulse
A Tasmanian public-health literacy, prevention and population-health information project — the first we built, and the standard the rest of our work is held to.
It also installs like an app: open the live tool on your phone or desktop and choose Install app from its menu bar (or your browser’s own “Add to Home Screen”) — it keeps working offline once installed.
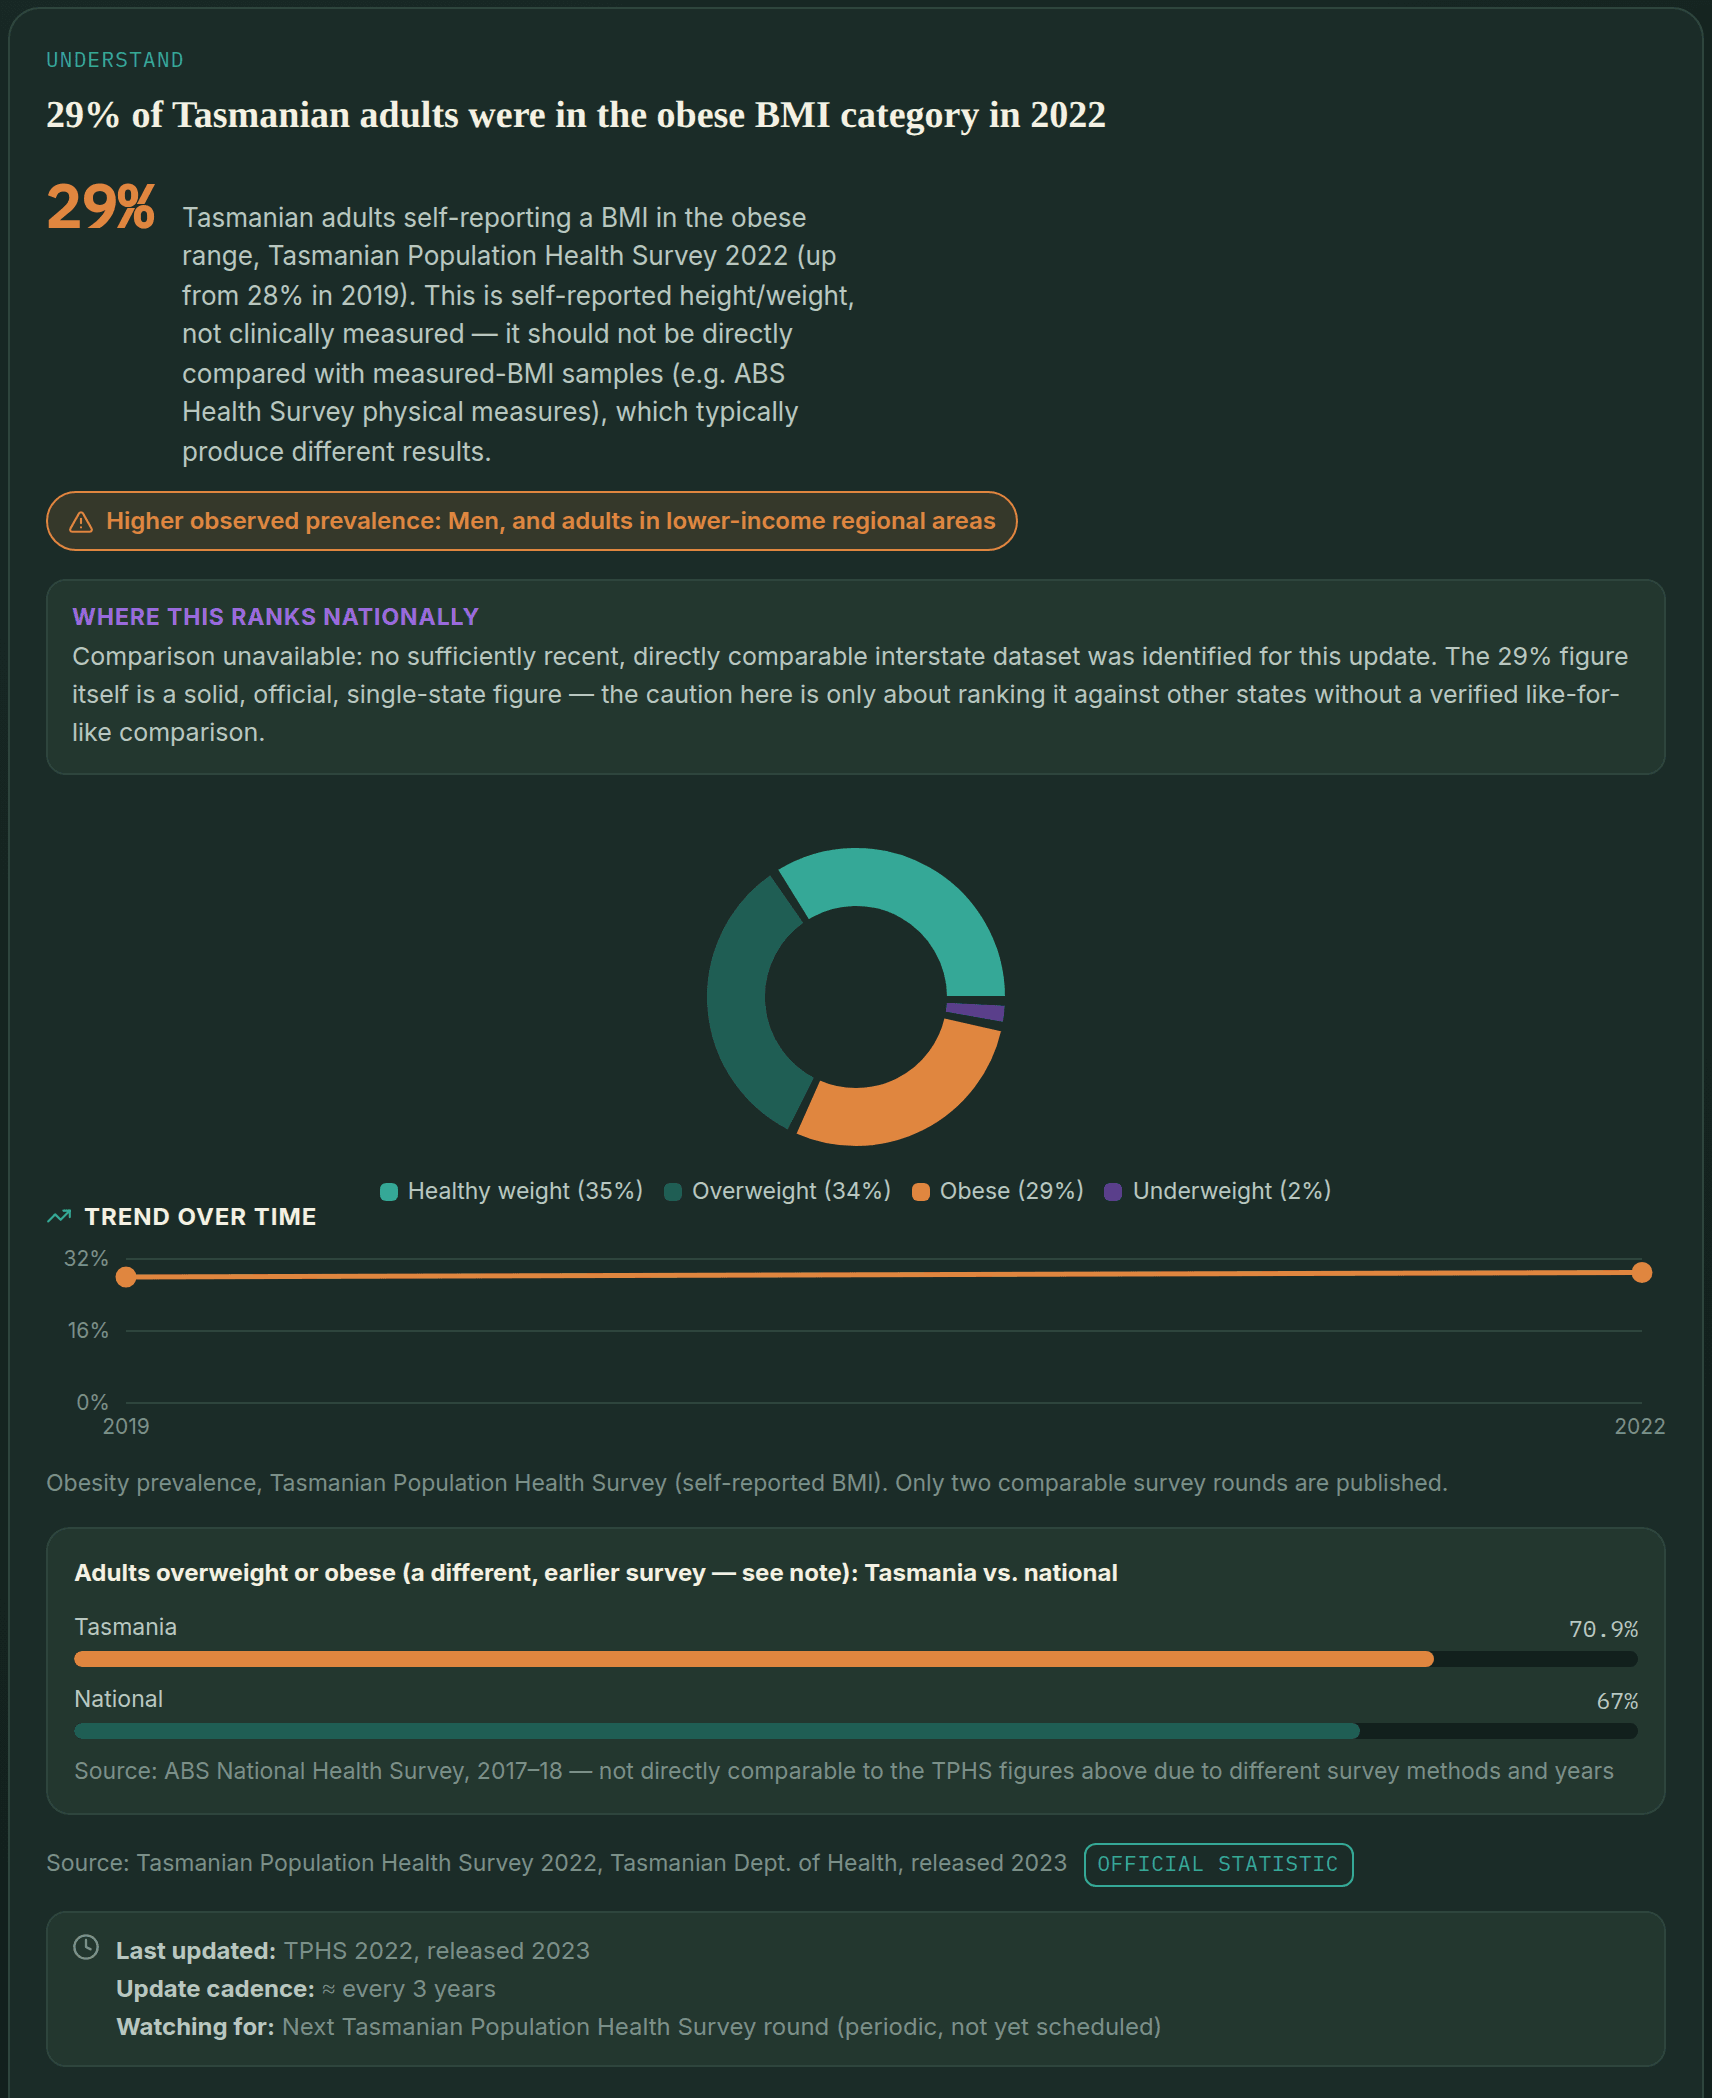
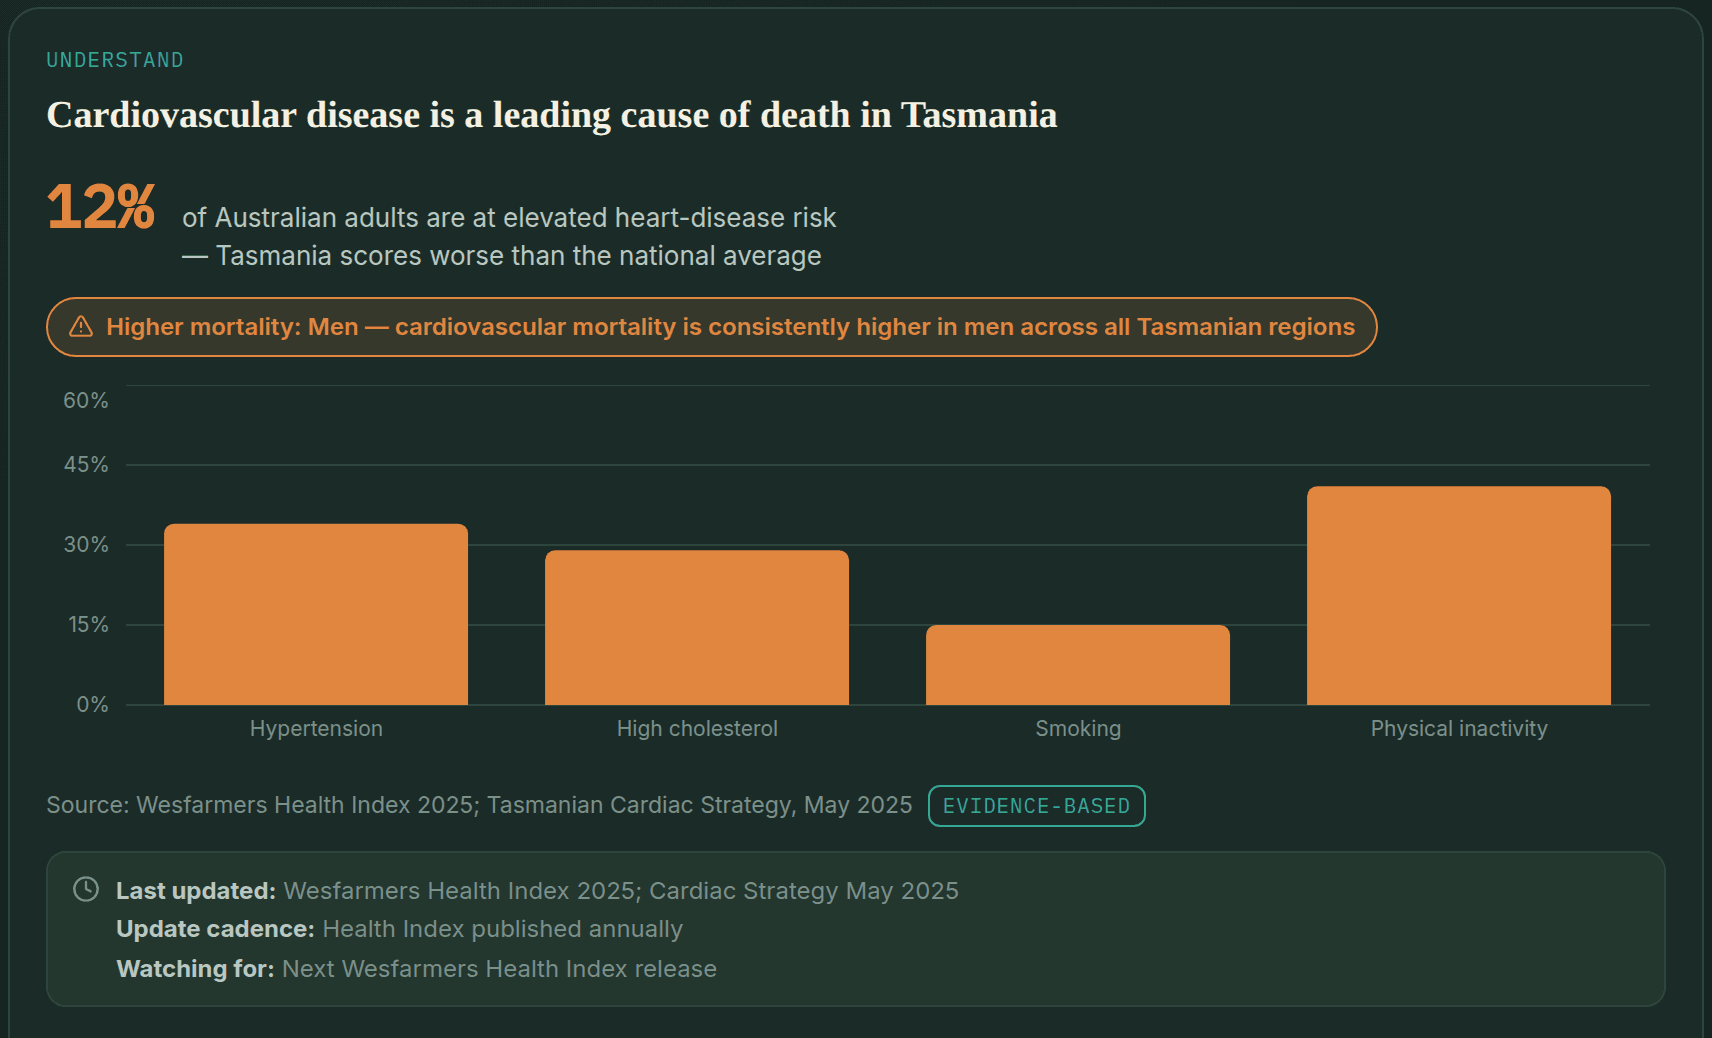
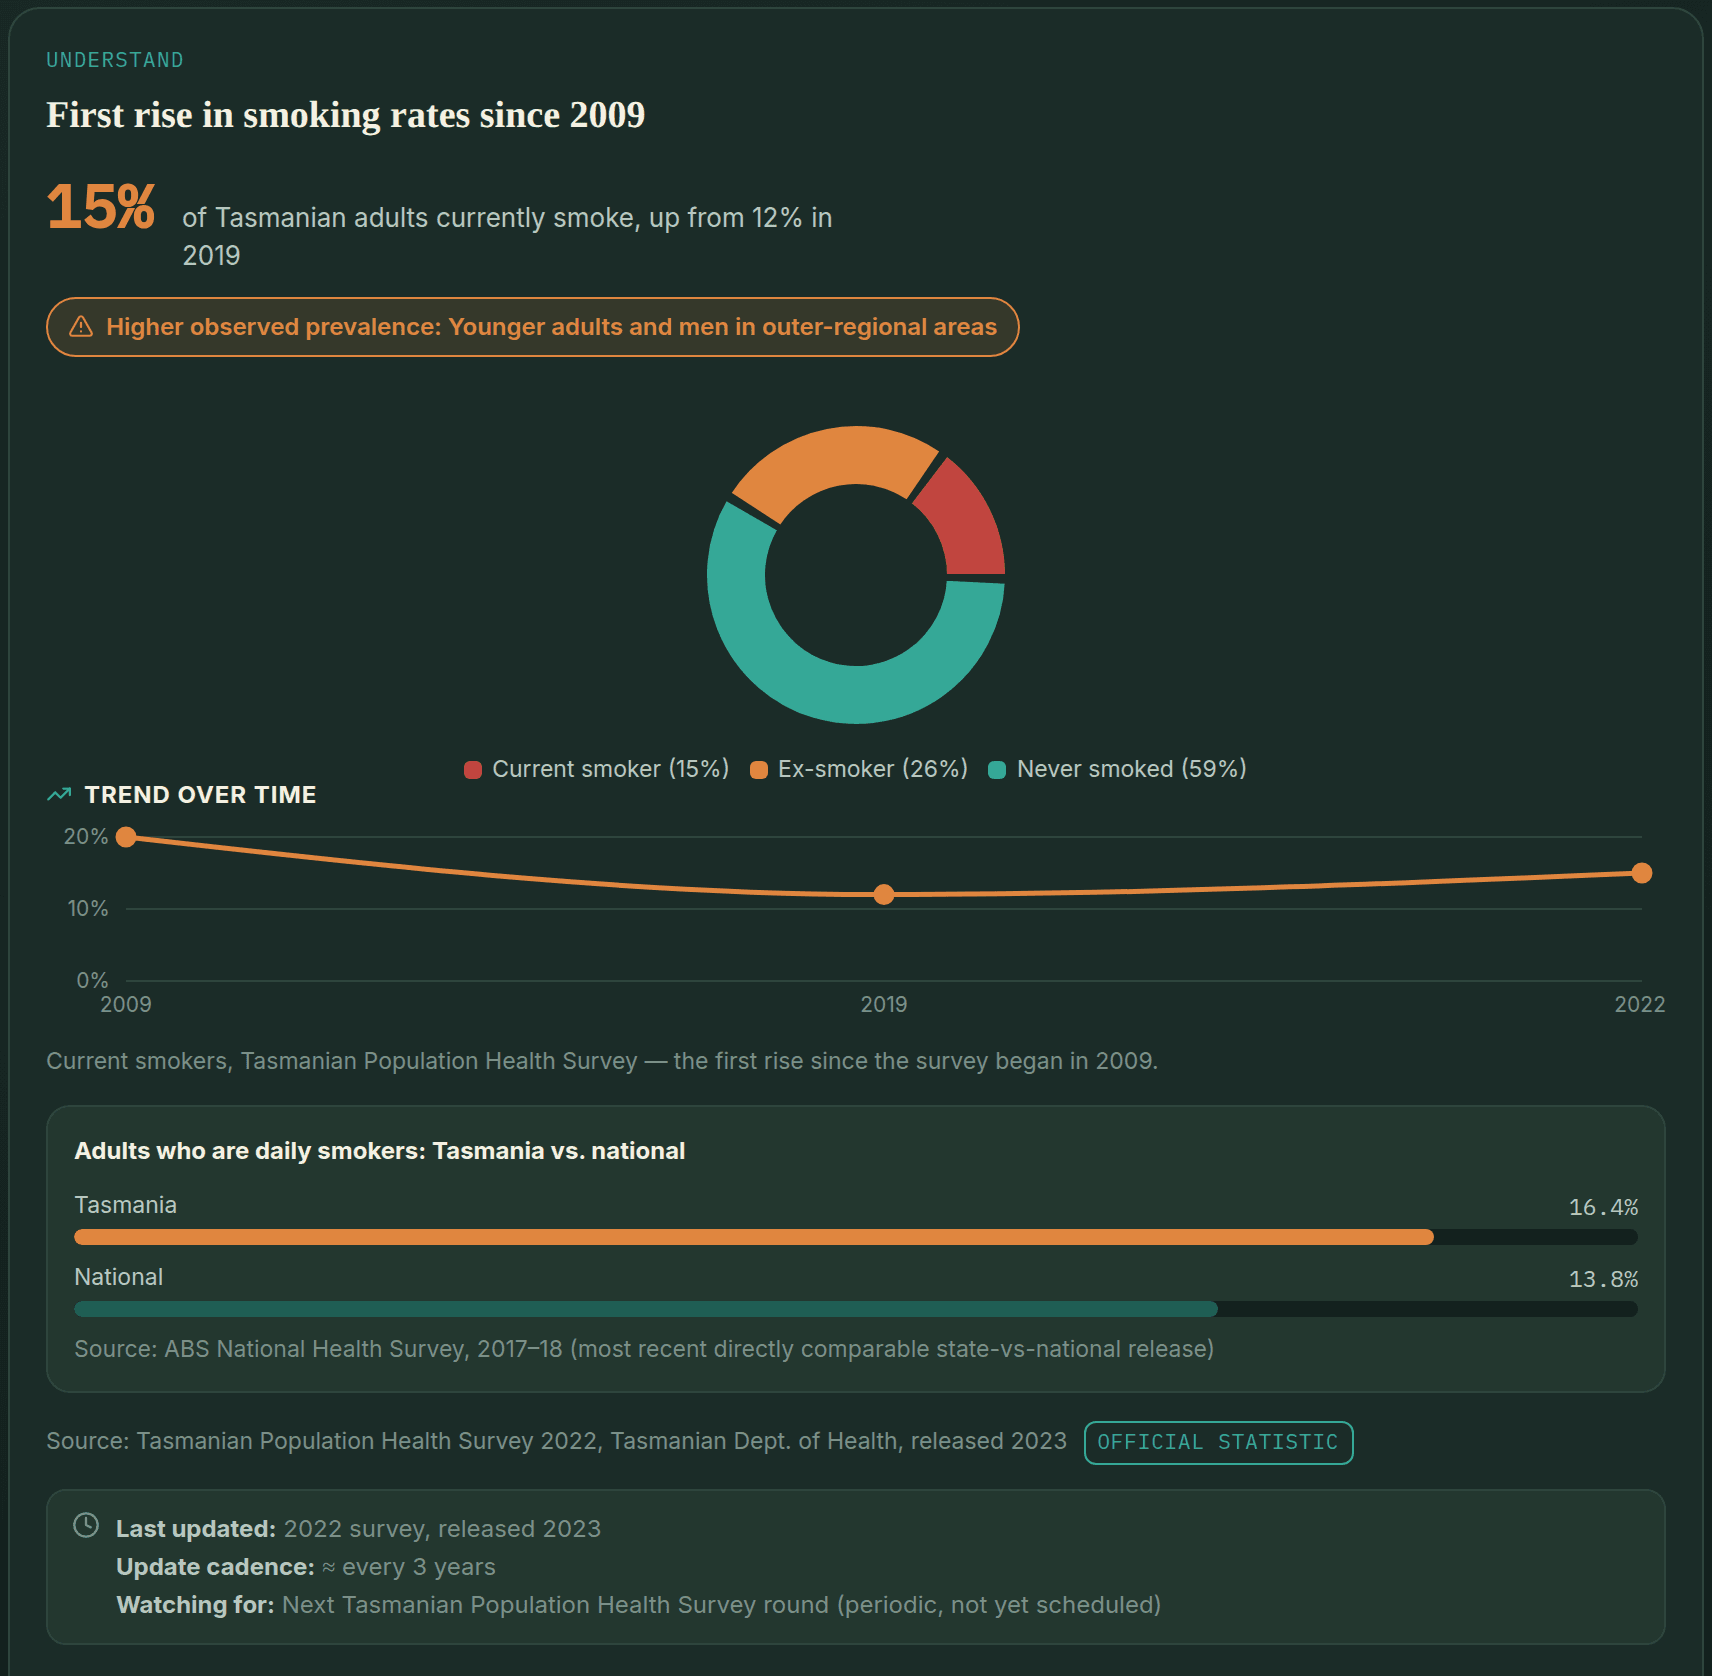
Tas Health Pulse turns population-health data — health status indicators, risk factors, prevalence and trends — into a plain-English tool for finding preventive care and screening, built with health literacy and access in mind rather than just accuracy in the abstract. We built and tested it in Tasmania first: a state-sized population was large enough to be a genuine test, and small enough to review properly. We built the same evidence-tier and governance approach to extend to other states and territories from the start.
Consumers navigating prevention and screening, health-literacy professionals, and public-health practitioners who need a tool they can point people to without caveats — tested using Tasmanian data, with the same approach designed to extend elsewhere.
Anatomy-based screening logic
Screening pathways are organised by anatomy and risk factors, not by gender-binary categories — so the guidance reflects what a person actually needs to be screened for, not an assumption based on their listed sex.
An explicit evidence-tier system
Every statistic on the dashboard is tagged with its evidence tier, source, and year, visible to the user rather than buried in a methodology page nobody reads.
Governance and privacy disclosures
What the tool does and doesn't do with a user's information is stated in plain language, alongside the same review-and-revision governance described in our approach.
No proprietary risk scores
The dashboard doesn't generate a pseudo-clinical risk score dressed up as personalised medicine. It points people to the right screening or service, and stops there.
Tas Health Pulse is live as a public-health education and navigation resource — not yet a clinically endorsed service. Clinical review, First Nations cultural review, independent accessibility testing, and a deployment-level privacy review are still pending. The tool’s own Governance & Safety tab discloses this openly, with a dated change log — that’s where the status lives, so it stays current instead of going stale in a caveat on this page. It was built and tested in Tasmania first, with the same approach meant to extend to other states permanently, not stop here.
My Council Pulse
Live — TasmaniaHealth data for every one of Tasmania’s 29 councils.
Tasmania has a single Primary Health Network, so the council area is the most local level at which official health data are published. My Council Pulse sets out each council’s population, long-term conditions, risk factors, screening, preventable hospital admissions and deaths under 75 from the 2021 Census and PHIDU’s Social Health Atlas — and compares any two councils side by side, only calling a difference where the data support it. Census figures can also be compared across Tasmania’s five state electorates.
The Health Pulse series
Live — 60 more regionsThe same model, built and deployed region by region.
Every region below is live, deployed, and installable the same way Tas Health Pulse is — each with its own sourced, evidence-tiered data and its own Sources & Methodology and Governance & Safety tabs. Clinical review, independent accessibility testing and First Nations cultural review are still in progress across the series, including ongoing outreach to the Aboriginal and Torres Strait Islander communities each region covers — each app discloses exactly where that stands, rather than waiting to say anything until every review is complete.
Sunshine Coast
LiveQueensland · ~457,359 people
The first build beyond Tasmania — testing the same evidence-tier approach at a single-region scale inside a much larger state.
View the live tool ↗Wide Bay
LiveQueensland · ~220,315 people
Bundaberg, Fraser Coast and North Burnett — the Hospital and Health Service's own legal catchment, independently fact-checked against secondary sources before shipping.
View the live tool ↗Riverland Mallee Coorong
LiveSouth Australia · ~71,190 people
South Australia's Murray River and Mallee country, researched from scratch rather than fact-checked from an imported draft.
View the live tool ↗Central West NSW
LiveNew South Wales · ~185,741 people
Bathurst to the western plains — the 11 Central West councils of Western NSW Local Health District, with Mudgee added mid-build and Lithgow later moved to Nepean Blue Mountains.
View the live tool ↗Central Queensland
LiveQueensland · ~229,266 people
Rockhampton to the Bowen Basin, with Woorabinda's own diabetes and mental-health data kept as its own sub-area rather than folded into the region.
View the live tool ↗South West WA
LiveWestern Australia · ~184,513 people
Bunbury to Margaret River, disclosing an unresolved maternity and ambulance-ramping crisis rather than a tidy resolution.
View the live tool ↗Gippsland
LiveVictoria · ~300,664 people
Six councils matched exactly to the ABS Gippsland SA4, anchored by Mallacoota's long-documented emergency-care access gap.
View the live tool ↗Hume
LiveVictoria · ~272,259 people
Ten councils mapped from the new Hume Local Health Service Network, including the cross-border Albury Wodonga hospital funding impasse.
View the live tool ↗Great Southern WA
LiveWestern Australia · ~61,838 people
Albany to Katanning — the first build to find no standalone community-controlled Aboriginal Medical Service anywhere in its catchment.
View the live tool ↗Darling Downs
LiveQueensland · ~287,837 people
Toowoomba to Goondiwindi, with this series' most thoroughly researched Aboriginal health section — four confirmed ACCHOs across the catchment.
View the live tool ↗Kimberley
LiveWestern Australia · ~35,085 people
Broome to Kununurra, built under explicit instruction for particular care on Aboriginal health — 100+ remote communities, carefully caveated.
View the live tool ↗Central Australia
LiveNorthern Territory · ~41,400 people
The first Northern Territory build — Alice Springs, MacDonnell and Central Desert, anchored by the Aboriginal-led Culture Care Connect suicide-prevention team.
View the live tool ↗Riverina
LiveNew South Wales · ~192,876 people
The third NSW build — Wagga Wagga to Griffith, anchored by the Riverina's own reported 'heart attack capital of NSW' status and the lowest cervical screening participation of any PHN area nationally.
View the live tool ↗Far North Queensland
LiveQueensland · ~285,959 people
The fifteenth region — Cairns and its Hospital and Health Service catchment, anchored by record 2024-25 wet-season melioidosis cases and a First Peoples burden-of-disease profile the highest of any HHS area in Queensland.
View the live tool ↗Barossa Hills Fleurieu
LiveSouth Australia · ~211,374 people
The sixteenth region, and our largest population yet — Barossa vineyards to a remote island, anchored by a real post-bushfire mental health surge and a genuine bright spot: the country's second-highest bowel screening participation rate.
View the live tool ↗Wheatbelt WA
LiveWestern Australia · ~76,394 people
The seventeenth region, and by far our largest catchment by council count — 43 Wheatbelt shires across four WACHS service areas, anchored by a statistically significant obesity gap confirmed at both adult and child level.
View the live tool ↗Midwest WA
LiveWestern Australia · ~63,650 people
The eighteenth region — Geraldton's Indian Ocean coast to the Murchison outback, anchored by a confirmed obesity and alcohol-harm gap and a genuine bowel-screening participation success story, with a disputed area and council count disclosed rather than silently resolved.
View the live tool ↗Yorke and Northern
LiveSouth Australia · ~76,526 people
The nineteenth region — Yorke Peninsula's #1-in-the-country bowel screening participation rate sits alongside Port Pirie's own, decades-long child blood-lead exposure story, with a disputed cardiovascular-disease ranking disclosed rather than asserted either way.
View the live tool ↗North West Queensland
LiveQueensland · ~28,889 people
The twentieth region — Mount Isa to the Gulf of Carpentaria, anchored by a coroner's finding that "systems failed" three Doomadgee women who died of rheumatic heart disease, alongside Mount Isa's own long-documented childhood lead-exposure story and the highest all-cause death rate of any Queensland Hospital and Health Service.
View the live tool ↗Far West NSW
LiveNew South Wales · ~28,974 people
The twenty-first region, and the fourth in NSW — Broken Hill to the Unincorporated Far West, anchored by a five-year life-expectancy gap with Sydney, the state's highest smoking-in-pregnancy rate, and a 30-year, still-running childhood blood-lead surveillance program left by the city's own mining history.
View the live tool ↗Murray River NSW
LiveNew South Wales · ~54,027 people
The twenty-second region, and the fifth in NSW — five Murrumbidgee Local Health District council areas that filled a real, user-noticed gap on this series' own map, anchored by a live proposal to split that health district in two and a public hospital with no registered doctors.
View the live tool ↗Goldfields WA
LiveWestern Australia · ~54,596 people
The twenty-third region, and the sixth in WA — Kalgoorlie's Super Pit to Esperance's coast, anchored by the 2006–07 Esperance lead contamination event and a prostate cancer rate that, uniquely among this series' WA builds, sits close to the state average rather than far above it.
View the live tool ↗Eyre and Far North
LiveSouth Australia · ~39,147 people
The twenty-fourth region, and the fourth in South Australia — Port Lincoln's tuna fleet to the red-desert APY Lands and Maralinga, anchored by an officially-stated 11%+ Aboriginal population share, three confirmed Aboriginal-run health services, and Maralinga Tjarutja's own nuclear-testing history.
View the live tool ↗Top End
LiveNorthern Territory · ~214,900 people
The twenty-fifth region, and the second in the Northern Territory — Darwin to Arnhem Land, Katherine and the Gulf, with Greater Darwin kept separate from the remote Top End. A first build: melioidosis and rheumatic heart disease context, NT-wide chronic disease figures labelled as such, and several figures still marked verification pending.
View the live tool ↗Grampians
LiveVictoria · ~249,670 people
The twenty-sixth region, and the third in Victoria — Ballarat to the Wimmera, built on the Grampians Public Health Unit's own 11-council map, anchored by Census 2021 figures showing diagnosed mental health conditions, asthma and arthritis well above the Victorian rate even after allowing for age.
View the live tool ↗Barwon South West
LiveVictoria · ~465,070 people
The twenty-seventh region, and the fourth in Victoria — Geelong to the South Australian border, with Greater Geelong kept separate from the rest of the region. Census 2021 shows diagnosed mental health conditions and asthma above the Victorian rate, most of all in Geelong, and diabetes a little below it.
View the live tool ↗Gold Coast
LiveQueensland · ~640,779 people
The twenty-eighth region, and the seventh in Queensland — the Gold Coast Hospital and Health Service area, broken down into the ABS's ten Gold Coast areas. Diagnosed rates sit at or below Queensland's for every condition, but homelessness, housing stress, mental health service demand and the state's lowest public dental use show the gaps behind the average.
View the live tool ↗Townsville
LiveQueensland · ~235,772 people
The twenty-ninth region, and the eighth in Queensland — Townsville to Hughenden and Palm Island, with every council shown separately. Census 2021 shows diagnosed diabetes and heart disease above the Queensland rate, and diabetes far higher on Palm Island.
View the live tool ↗Mackay
LiveQueensland · ~180,889 people
The thirtieth region, and the ninth in Queensland — Mackay, the Bowen Basin and the Whitsundays. Census 2021 shows diagnosed diabetes and heart disease above the Queensland rate, and Queensland Health's 2025–26 survey finds one adult in seven smokes daily.
View the live tool ↗Northern NSW
LiveNew South Wales · ~311,177 people
The thirty-first region, and the fifth in New South Wales — the Northern NSW health district, from the Tweed to the Clarence. Census 2021 shows diagnosed mental health conditions and lung disease well above the NSW rate, and Byron has the state's highest melanoma rate.
View the live tool ↗Mid North Coast
LiveNew South Wales · ~229,869 people
The thirty-second region, and the sixth in New South Wales — the Mid North Coast health district, from Port Macquarie to Coffs Harbour. Census 2021 shows diagnosed mental health conditions, lung disease and arthritis well above the NSW rate, and one adult in six smoked daily in 2020.
View the live tool ↗South West QLD
LiveQueensland · ~23,830 people
The thirty-third region, and the tenth in Queensland — South West Queensland, from Roma to Thargomindah across 320,000 km². Census 2021 shows diagnosed diabetes and asthma above the Queensland rate, and adult obesity is the second highest of any Queensland health service.
View the live tool ↗Southern NSW
LiveNew South Wales · ~219,353 people
The thirty-fourth region, and the seventh in New South Wales — Southern NSW, from Goulburn and Yass to the snowfields and the far south coast. Census 2021 shows diagnosed mental health conditions, arthritis and asthma above the NSW rate in every council.
View the live tool ↗Barkly
LiveNorthern Territory · ~6,316 people
The thirty-fifth region, and the third in the Northern Territory — the Barkly, from Tennant Creek across the Barkly Tablelands, completing the map's coverage of the NT. Census 2021 shows diagnosed diabetes and kidney disease at about double the NT rate.
View the live tool ↗Loddon Mallee
LiveVictoria · ~296,176 people
The thirty-sixth region, and the fourth in Victoria — the Loddon Mallee, from the Macedon Ranges and Bendigo to Mildura and the Murray. Census 2021 shows arthritis, asthma and lung conditions above the Victorian rate in every council.
View the live tool ↗Central West QLD
LiveQueensland · ~10,562 people
The thirty-seventh region, and the eleventh in Queensland — the Central West, from Alpha and Longreach to Birdsville across the Channel Country. Census 2021 shows diagnosed diabetes above the Queensland rate.
View the live tool ↗Limestone Coast
LiveSouth Australia · ~66,847 people
The thirty-eighth region, and the fifth in South Australia — the Limestone Coast, from Bordertown and Naracoorte to Mount Gambier and Port MacDonnell. Census 2021 shows the region close to the South Australian rate on most conditions, with Mount Gambier higher than the rest of the region.
View the live tool ↗Flinders and Upper North
LiveSouth Australia · ~40,695 people
The thirty-ninth region, and the sixth in South Australia — the Flinders and Upper North, from Whyalla and Port Augusta to Quorn, Hawker and Roxby Downs. Census 2021 shows diabetes, asthma and heart disease above the South Australian rate, and smoking is clearly above it in Whyalla and Port Augusta.
View the live tool ↗Pilbara
LiveWestern Australia · ~58,237 people
The fortieth region, and the seventh in Western Australia, completing the WA Country Health Service regions — the Pilbara, from Karratha and Port Hedland to Newman and Onslow. Deaths before 75 from heart disease and from diabetes are far above the WA rate, and bowel screening is well below it.
View the live tool ↗Orana
LiveNew South Wales · ~98,036 people
The forty-first region, and the eighth in New South Wales — the Orana, from Dubbo and Gilgandra to Bourke, Brewarrina and Lightning Ridge, completing western NSW with Central West and Far West. Deaths before 75 from heart and circulatory disease are well above the NSW rate, COPD admissions are more than twice it, and bowel screening is below it.
View the live tool ↗New England & North West
LiveNew South Wales · ~187,038 people
The forty-second region, and the ninth in New South Wales — New England and the North West, from Tamworth and Armidale to Moree, Narrabri and Tenterfield. About 4 in 10 adults are obese, smoking and psychological distress are above the NSW rate, and hospital admissions for diabetes complications and COPD are well above it.
View the live tool ↗Hunter
LiveNew South Wales · ~775,006 people
The forty-third region, and the tenth in New South Wales, completing Hunter New England Local Health District with New England and North West — the Hunter, from Newcastle and Lake Macquarie to Maitland, Muswellbrook and the Mid-Coast. More than 1 in 3 adults are obese, heavy drinking and psychological distress are well above the NSW rate, and deaths before 75 from cancer, heart disease and COPD are above it.
View the live tool ↗Illawarra Shoalhaven
LiveNew South Wales · ~422,712 people
The forty-fourth region, and the eleventh in New South Wales — the Illawarra and Shoalhaven, from Wollongong and Shellharbour to Kiama and Nowra. Heavy drinking is clearly above the NSW rate in all four councils, psychological distress is above it, and new lung cancers are clearly above it in Wollongong, Shellharbour and Shoalhaven.
View the live tool ↗Central Coast
LiveNew South Wales · ~348,493 people
The forty-fifth region, and the twelfth in New South Wales, completing the state's regional local health districts — the Central Coast, from Gosford and Woy Woy to Wyong and The Entrance. Obesity, smoking, heavy drinking and psychological distress are clearly above the NSW rate, COPD admissions are about 1.4 times it, and deaths before 75 from cancer and COPD are clearly above it.
View the live tool ↗Metro North (Brisbane)
LiveQueensland · ~1,073,241 people
The first metropolitan Brisbane app — Metro North Hospital and Health Service, from the city and Chermside to Redcliffe, Caboolture and Bribie Island, about a million people. Across the whole region most risk factors are at or below the Queensland rate, but smoking, early heart-disease deaths and obesity are clearly above it in parts of Moreton Bay and the north.
View the live tool ↗Nepean Blue Mountains
LiveNew South Wales · ~383,511 people
Completing metropolitan Sydney — Nepean Blue Mountains Local Health District, Penrith, the Blue Mountains, Hawkesbury and Lithgow, about 380,000 people. Adult obesity is clearly above the NSW rate in 8 of the 15 areas and early heart-disease deaths are above it across the region; smoking, obesity, distress and early heart-disease deaths are all clearly above it in St Marys – Colyton.
View the live tool ↗South Eastern Sydney
LiveNew South Wales · ~894,303 people
The fifth Sydney app — South Eastern Sydney Local Health District, the eastern suburbs, the CBD and inner east, St George and Sutherland, about 890,000 people. No area is clearly above the NSW rate on smoking, obesity, distress or early heart-disease deaths, but homelessness is about 1.4 times the state rate, and monthly heavy drinking is clearly above it in eight areas, among them Bondi, Coogee and Cronulla.
View the live tool ↗Northern Sydney
LiveNew South Wales · ~931,252 people
The fourth Sydney app — Northern Sydney Local Health District, the North Shore, Ryde, Hornsby and the Northern Beaches, about 930,000 people. No area is clearly above the NSW rate on smoking, obesity, distress or early heart-disease deaths, and early heart-disease deaths are about half the state rate; monthly heavy drinking is clearly above it in five areas, among them Manly and the Pittwater suburbs.
View the live tool ↗Western Sydney
LiveNew South Wales · ~1,067,165 people
The third Sydney app — Western Sydney Local Health District, Blacktown, Cumberland, Parramatta and The Hills, about 1.07 million people. Smoking, obesity and distress are below the NSW rate across the whole region, but diagnosed diabetes is about 1.3 times the state rate, and early heart-disease deaths are clearly above it in five areas, among them Mount Druitt, Blacktown and Granville.
View the live tool ↗Sydney LHD
LiveNew South Wales · ~662,151 people
The second Sydney app — Sydney Local Health District, the inner west, inner Sydney and Canterbury, about 660,000 people. Smoking and obesity are well below the NSW rate across the whole region, but homelessness is about twice the state rate, and early heart-disease deaths are clearly above it in Chippendale – Redfern – Waterloo.
View the live tool ↗South Western Sydney
LiveNew South Wales · ~1,051,620 people
The first Sydney app — South Western Sydney Local Health District, from Bankstown, Fairfield and Liverpool to Campbelltown, Camden and the Southern Highlands, about 1.05 million people. Adult obesity, smoking and diagnosed diabetes are above the NSW rate across the whole region; smoking, obesity and distress are all clearly above it in Ashcroft – Busby – Miller, Campbelltown – Woodbine and Liverpool – Warwick Farm.
View the live tool ↗Southern Adelaide
LiveSouth Australia · ~377,999 people
Completing metropolitan Adelaide — Southern Adelaide Local Health Network, from Glenelg and Mitcham to Morphett Vale, McLaren Vale and Aldinga, about 380,000 people. Across the whole region smoking and distress are at or below the SA rate, but smoking, obesity, distress and early heart-disease deaths are all clearly above it in Christie Downs – Hackham West.
View the live tool ↗Northern Adelaide
LiveSouth Australia · ~423,002 people
The second Adelaide app — Northern Adelaide Local Health Network, from Enfield and Modbury to Salisbury, Elizabeth and Davoren Park, about 420,000 people. Adult obesity, smoking and psychological distress are above the SA rate across the whole region, all three are clearly above it in Davoren Park and Elizabeth – Smithfield, and early heart-disease deaths are clearly above it in five areas.
View the live tool ↗Central Adelaide
LiveSouth Australia · ~482,241 people
The first Adelaide app — Central Adelaide Local Health Network, the city and its inner and western suburbs, about 480,000 people, mapped to SA Health's own network boundary. Across the whole region smoking, obesity and psychological distress are below the SA rate, but early heart-disease deaths are clearly above it in Port Adelaide, Charles Sturt – North West and Largs Bay – Semaphore.
View the live tool ↗East Metro (Perth)
LiveWestern Australia · ~737,038 people
Completing metropolitan Perth — East Metropolitan Health Service, from the city and Mount Lawley to Midland, the hills, Gosnells and Armadale, about 740,000 people. Across the whole region obesity and distress are close to the WA rate, but both are clearly above it in Armadale, Seville Grove, Kelmscott – Champion Lakes and Gosnells – Maddington, and early heart-disease deaths are clearly above it in five areas, including Armadale and Midland.
View the live tool ↗South Metro (Perth)
LiveWestern Australia · ~690,215 people
The second Perth app — South Metropolitan Health Service, from Applecross and Fremantle to Kwinana, Rockingham and Peel, about 690,000 people. Across the whole region smoking, obesity and distress are close to the WA rate, but all three are clearly above it in Rockingham, Safety Bay – Warnbro, Kwinana – West and central Mandurah.
View the live tool ↗North Metro (Perth)
LiveWestern Australia · ~764,585 people
The first of three apps for metropolitan Perth — North Metropolitan Health Service, from Cottesloe and Leederville to Mirrabooka, Joondalup and Yanchep, about 765,000 people, mapped to the boundary WA's Health Services Order sets. Across the whole region smoking, obesity and psychological distress are below the WA rate, but obesity and distress are clearly above it in Balga – Mirrabooka and Butler – Clarkson.
View the live tool ↗Metro South (Brisbane)
LiveQueensland · ~1,201,027 people
Completing metropolitan Brisbane with Metro North — Metro South Hospital and Health Service, from South Brisbane and Mount Gravatt to Logan, Redland and Beaudesert, about 1.2 million people. Across the whole region smoking, obesity and psychological distress are below the Queensland rate, but obesity is clearly above it in 10 of Logan's 15 areas, and smoking, distress and early heart-disease deaths are clearly above it in several Logan areas, Inala and North Stradbroke Island.
View the live tool ↗West Moreton
LiveQueensland · ~313,586 people
West Moreton Hospital and Health Service — Ipswich and Springfield, the Lockyer Valley, and the Boonah and Esk areas — mapped to its official boundary, which takes in parts of councils. Adult obesity is clearly above the Queensland rate in 11 of its 14 areas, and psychological distress in 9.
View the live tool ↗Canberra (ACT)
LiveAustralian Capital Territory · ~452,508 people
The first app for the Australian Capital Territory — Canberra and the whole ACT, from Gungahlin to Tuggeranong, with figures for its eight districts and Australia as the comparison. Adult smoking, obesity and psychological distress are clearly below the Australian rate, new prostate cancer diagnoses are clearly above it, and heavy drinking is clearly above it in North and South Canberra.
View the live tool ↗Also building
In developmentMoth AI
A separate project from the health-literacy tools above: a funding-intelligence platform that helps Tasmanian community and health organisations find funding opportunities they actually qualify for. It’s held to the same provenance discipline as the rest of our work — every opportunity and organisation record carries a source, a confidence level, and a verification history, rather than being presented as fact by default. Matching is explainable, not a black-box score: an organisation sees why an opportunity fits — shared sector, eligible location, open status — laid out plainly instead of reduced to a probability score.
Currently tracking 204 real funding opportunities across 23 sectors (202 independently verified against their official source) and 1009 real organisations, drawn from 8 registered sources — figures that update automatically as ingestion and verification continue, not a snapshot that goes stale the week after we write it.
A second capability sits alongside funding matching: policy comparison. Real Tasmanian and Commonwealth policies can be recorded and compared side by side — shared focus areas, jurisdiction, status, target population — as the same kind of explainable factor breakdown, with no similarity score attached. From a comparison, or from a single policy on its own, Moth AI can also draft possible policy options and project ideas — each option carrying its own considerations, drawn only from that policy’s recorded facts and any related intergovernmental agreements Moth already connects to it by sector. No option is ever singled out as preferred. Every draft is labelled an unreviewed starting point for a person to verify and rewrite — a prompt for a person’s judgement, not a decision Moth claims to have made.
Policies aren’t siloed from the funding and organisation records either: recording one automatically surfaces it wherever an organisation or funding opportunity shares a sector tag, and the reverse holds too. Currently tracking 43 real policies across 23 of Moth’s 27 sector tags — the gaps are shown too, not hidden, since knowing a sector has no recorded policy is itself useful to know. Every policy also carries its own review date, tracked and flagged the moment it lapses rather than quietly going stale once entered.
A third record type sits alongside policies: intergovernmental agreements — the Commonwealth’s actual funding architecture (National Partnerships, National Agreements, the Federation Funding Agreements they sit within), each carrying named parties, funding, reporting obligations and its own expiry, with jurisdiction-scoped schedules underneath where the real agreement has them. The same sector-tag discovery connects agreements to policies, funding opportunities and organisations automatically. Currently tracking 13 real agreements across 18 sector tags.
A fourth record type tracks the numbers behind all of this: real public-health statistics over time — a smoking rate, a hospitalisation count, anything with a value and a date. Trend direction, magnitude and any reversal are computed deterministically from the recorded data points. Nothing here is predicted or AI-generated. In fact this is the strictest rule on the whole platform: a number reaches Moth by being typed in directly, parsed from a pasted table (including one converted from an uploaded PDF or spreadsheet), or read off a named field in a real government open-data API — a model is never the one doing the transcribing. Two series can be compared the same explainable way as two policies: shared sector, matching region, comparable units, and whether their trends move the same way. That comparison stops there; it doesn’t imply a correlation, and it certainly doesn’t claim one trend causes the other. A series’ draft suggestions work the same way, grounded only in its own computed trend and whatever related policy or agreement Moth already connects to it by sector — the model can describe what the data shows, but it isn’t allowed to guess at why. Currently tracking 118 real statistical series across 1 sector tags.
The same discipline extends further: programs and their evaluations, service agreements and their delivery milestones, and structured consultation tracking against a policy or program — each connected into the same sector-tag discovery as everything above, so nothing sits in a silo the rest of the platform can’t see.
The matching platform itself is private, built for organisations we work with directly rather than open self-signup — get in touch if that’s you. Its public face is a grants calendar, listing verified funding rounds by sector for anyone to check, no account required.
View the public grants calendar ↗Work in progress
Ambulance Tasmania Fatigue Calculator
A proposed digital tool exploring safer, more immediate communication between paramedics and Deployment Supervisors when fatigue may affect operational readiness — designed so a supervisor sees only the operational fatigue status needed for a safe deployment decision, never a paramedic’s confidential responses.
This project is a prototype and is not currently available for clinical or operational use. It has not been approved, commissioned or endorsed by Ambulance Tasmania or the Tasmanian Department of Health. Any future implementation would require appropriate clinical, operational, privacy, cybersecurity, legal and governance review.
Future work